Or, to be more precise, perhaps that title should read Why We’ll Continue to Test in IE7… For the Moment.
IE7 (Internet Explorer 7) causes us more than a few headaches. It’s a buggy browser with it’s own way of doing things (which is probably why there are now no less than 3 newer versions of this browser!) and fixing issues inherent to IE7 alone costs us valuable time on nearly every project. Suffice to say we’d like to drop it sooner rather than later.
But we can’t. We have to pay attention to current browser statistics and consider who will be accessing the websites we build and through what browser.
There are many different browser statistic resources on the internet (unfortunately none of which will ever be a completely true representation of global browser usage) and every month we review the most recently published statistics to see how things currently stand. We take note of the trends and figures but typically there’s not much to talk about, we see each browser’s popularity waxing or waning (pretty much every browser is taking a back seat to Google Chrome at the moment) and we move on.
How The Browser Scene Has Changed
| Internet Explorer | Firefox | Chrome | Safari | Opera | |
|---|---|---|---|---|---|
| W3Schools | 13.5% | 29.6% | 50.0% | 4.1% | 1.8% |
| StatCounter | 29.8% | 21.3% | 37.0% | 8.6% | 1.2% |
| Wikimedia | 23.4% | 18.7% | 41.9% | 3.0% | 3.4% |
| W3Counter | 26.6% | 19.7% | 29.3% | 15.4% | 2.4% |
| Clicky | 34.6% | 21.4% | 33.1% | 9.5% | 1.2% |
| NetApplications | 55.8% | 20.1% | 16.3% | 5.4% | 1.8% |
| AVERAGE | 30.6% | 21.8% | 34.6% | 7.7% | 2.0% |
February 2013 Desktop Browser Statistics
It’s interesting to see how the habits of internet users are changing. It’s important to note that these statistics may not reflect the browsers used to access your website (you can see this data in your Google Analytics account, and ultimately the browsers used to access your website should be your priority) but, with more and more people aware that they have a choice of browser, they can be used as a benchmark.
W3Schools themselves have a small disclaimer on site, noting how the browser statistics they publish are a reflection of their visitors only:
Note: W3Schools is a website for people with an interest for web technologies. These people are more interested in using alternative browsers than the average user. The average user tends to use the browser that comes pre-installed with their computer, and do not seek out other browser alternatives.
Tip: Global averages may not be relevant to your web site. Different sites attract different audiences. Some web sites attract professional developers using professional hardware, while other sites attract hobbyists using old computers.
If we take W3Schools as an example, they have been monitoring their global browser usage since 2002 so over a decade of statistics are available for our analysis. Way back in 2002 Internet Explorer was the main player, although there really wasn’t much choice for internet surfers at the time – anyone remember AOL or Netscape? With the introduction of newer, more reliable browsers over the years it’s been a downhill slide for IE who are now lumbering in with just a 13.5% share, and that’s divided across versions 6 through 10 of their browser.
Early versions of Internet Explorer were notoriously buggy (yes IE6, I mean you) so thank goodness for some new browsers arriving on the scene. Firefox, with a current share of 29.6%, started to gain prominence in 2005 with its popularity peaking at the notable figure of 47.9% in July 2009. Opera and Safari meanwhile were introduced to the market across 2006 and 2007 but have never really made much of a dent, hovering around 4% and 2% respectively for some years now.
The real success story here is Google Chrome though. Since it’s launch in late 2008 this browser has stormed up the charts, steadily pulling users away from other browsers, to impressively achieve a whopping 50% share of W3Schools browser access last month (coincidentally about the same share Internet Explorer had when Chrome was launched) and this dominance is also reflected in the other stat counters in the table above.
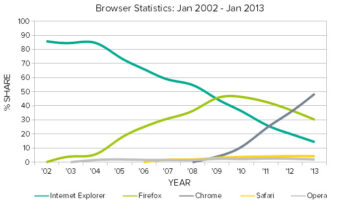
Annual Browser Statistics from W3Schools
To Test Or Not To Test
What mainly caught our attention in February 2013’s browser stats was the indication that Internet Explorer 7’s share has really started to dip (below 1% in W3Schools’ case).
February’s statistics also reveal that Internet Explorer 10’s share of the market is increasing rapidly. This browser’s share is only going to rise as people buy new PCs or upgrade their existing installations so adding IE10 to our testing procedure is a no-brainer.
The real dilemma is deciding when to take IE7 off the books.
It’s tough deciding when to drop a browser from your testing procedure and it’s a decision we don’t take lightly. After all, we want every site we build to be as accessible as possible and ultimately look and function the way it was intended to when it was designed.
Research into browser habits on some of the most popular sites we manage reveals that on many the proportion of visitors accessing the site through Internet Explorer 7 is as much as 2.1% – around Opera’s average.
Our Decision
In the end it’s been an incredibly tough decision – really, we’d like nothing more than to give IE7 the boot – but for the moment we’re going to continue to thoroughly test every website we build in Internet Explorer 7. If there’s any potential for our customers to lose business due to their site being poorly rendered in this browser then it’s important enough for us to go the extra mile.
We will, however, keep a close eye on the situation over 2013 until we can say without any doubt that it’s safe to drop IE7.